Over the past few months I’ve written about Ansible and the intersection of DevOps and Networking quite a few times. As network vendors continue to develop better APIs on network devices (switches, routers, FWs, etc.) there is no doubt going to be an emergence of new tools for the network industry. One of these emerging tools is Schprokits. Schprokits (company name and product name), still in stealth, was founded by Jeremy Schulman, who previously worked at Juniper and did the initial work for integrating Junos with Puppet, Chef, and Ansible, and on top of that developed the Juniper PyEZ Python framework. Schprokits seems to be the outcome of Schulman’s experiences working with existing DevOps automation platforms and building one now purpose built for networking. Over the past few weeks, I've been fortunate to be able to be part of the first Schprokits user-test group.
In this article, I’m going to explore not only working with Schprokits, but also working with AutoNetkit. AutoNetkit, part of the PhD thesis work of Simon Knight, is an application and framework for modeling network devices, both from a configuration and visualization/diagramming standpoint. Some of you may also realize AutoNetkit is used in the Cisco VIRL and Juniper Junosphere products too.
In this article, I’m going to explore not only working with Schprokits, but also working with AutoNetkit. AutoNetkit, part of the PhD thesis work of Simon Knight, is an application and framework for modeling network devices, both from a configuration and visualization/diagramming standpoint. Some of you may also realize AutoNetkit is used in the Cisco VIRL and Juniper Junosphere products too.
Note: this isn’t meant to be a deep dive on either Schprokits or AutoNetkit, but rather just one use case for automating the building of network diagrams based on real time state of the network. The following is just one example of a diagram that can be created in seconds.
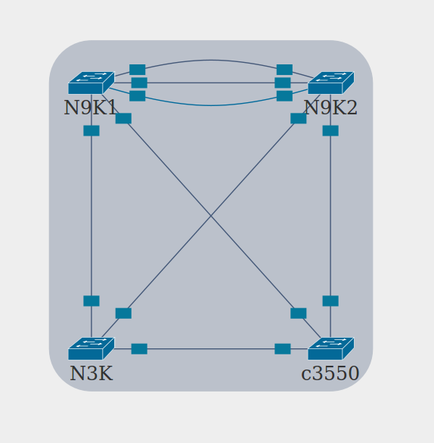
We’ll step through how this is done in the sections that follow.
Background
I have a lab with two (2) Nexus 9000 switches, (1) Nexus 3000, and (1) Catalyst 3550 switch. There are three (3) links inter-connecting the Nexus 9000 switches. This is to simulate VPC peerlinks (2) and a peer keeaplive link (1) although the VPC configuration doesn’t actually exist yet on the switches. The Nexus 3000 connects to each Nexus 9000. The Catalyst 3550 connects to each of the three (3) Nexus switches as it’s being used as an out of band management switch and connects to each of the switches mgmt0 interface.
The Goal
Remember the goal is create diagram(s) based on real time state. We’ll need to break this up logically. First, it should be understood that Schprokits is being used as the core automation engine here. Within Schprokits, we’ll be doing two major activities: Activity 1 will be to collect the data we need to create physical diagrams and Activity 2 will be to create the diagram(s).
Schprokits Tables/Views
Without programming, how do you extract the data needed from the Nexus switches? Going on a small tangent that we’ll bring back home very soon, it’s important to know Schprokits supports a concept called Tables/Views. Tables/Views makes it so ANYONE can get ANY data they wish out of the switch programmatically. Rather than try and explain it, let’s just see an example. This example will be using Tables/Views for NX-API devices via Schprokits.
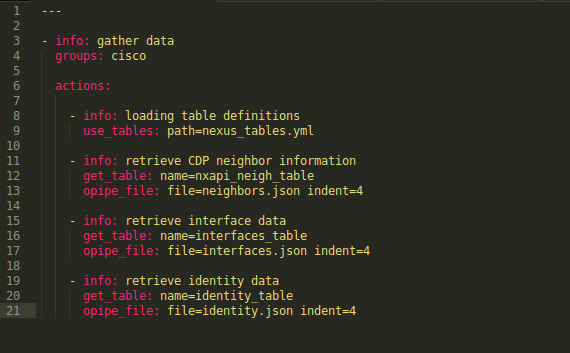
Within the Schprokits workbook below (filename of this file is nxapi_table_view.yml), you will see two actions. The first is to load table definitions and the second is to actually get the data (and store it to a local file).
Schprokits Workbook
Background
I have a lab with two (2) Nexus 9000 switches, (1) Nexus 3000, and (1) Catalyst 3550 switch. There are three (3) links inter-connecting the Nexus 9000 switches. This is to simulate VPC peerlinks (2) and a peer keeaplive link (1) although the VPC configuration doesn’t actually exist yet on the switches. The Nexus 3000 connects to each Nexus 9000. The Catalyst 3550 connects to each of the three (3) Nexus switches as it’s being used as an out of band management switch and connects to each of the switches mgmt0 interface.
The Goal
Remember the goal is create diagram(s) based on real time state. We’ll need to break this up logically. First, it should be understood that Schprokits is being used as the core automation engine here. Within Schprokits, we’ll be doing two major activities: Activity 1 will be to collect the data we need to create physical diagrams and Activity 2 will be to create the diagram(s).
Schprokits Tables/Views
Without programming, how do you extract the data needed from the Nexus switches? Going on a small tangent that we’ll bring back home very soon, it’s important to know Schprokits supports a concept called Tables/Views. Tables/Views makes it so ANYONE can get ANY data they wish out of the switch programmatically. Rather than try and explain it, let’s just see an example. This example will be using Tables/Views for NX-API devices via Schprokits.
Within the Schprokits workbook below (filename of this file is nxapi_table_view.yml), you will see two actions. The first is to load table definitions and the second is to actually get the data (and store it to a local file).
Schprokits Workbook
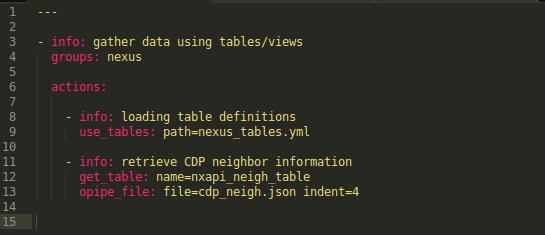
You will see that the all of tables are being loaded from nexus_tables.yml using the Schprokits core action called use_tables. I know it’s still not clear what tables are, but we’ll get there taking a top down approach.
Let’s now take a look inside the nexus_tables.yml file.
Table/View Definition
Let’s now take a look inside the nexus_tables.yml file.
Table/View Definition

The name of the table is totally arbitrary. I used nxapi_neigh_table. Next is the really cool part as you get to use the NX-API on the Nexus switches without needing to write any code. You see the command, item, key, and view. The command is self-explanatory, but since NX-API is just an API wrapping commands, this is the API/command being sent to the device. For other device types, the command may be an RPC call or any other type of API.
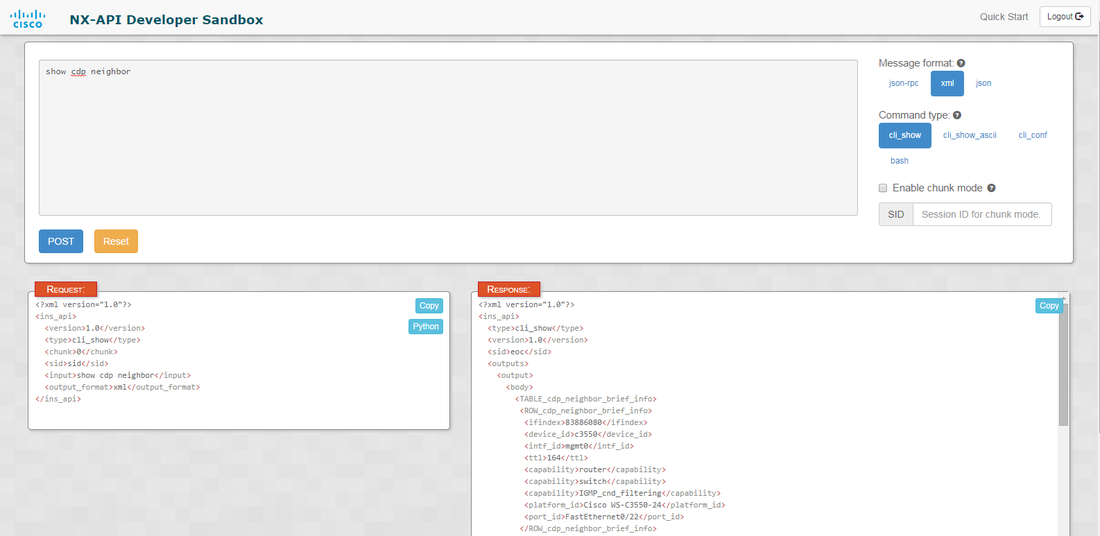
For those new to NX-API, Nexus devices that support NX-API actually support a sandbox environment to test and see the output of an API call. The picture below shows the sandbox output for executing the show cdp neighbor command via the API. The sandbox is viewed by going to http://nexus_switch_ip.
For those new to NX-API, Nexus devices that support NX-API actually support a sandbox environment to test and see the output of an API call. The picture below shows the sandbox output for executing the show cdp neighbor command via the API. The sandbox is viewed by going to http://nexus_switch_ip.
Let’s take a deeper look at the response (in the bottom right). In this next picture, all I did was copy and paste the response into my text editor to be able to capture more of it. This output shows the response for three (3) neighboring connections. The important part here is to see what sections comprise of a neighbor. What we can determine from the picture below is that every section called ROW_cdp_neighbor_brief_info denotes a new neighbor.
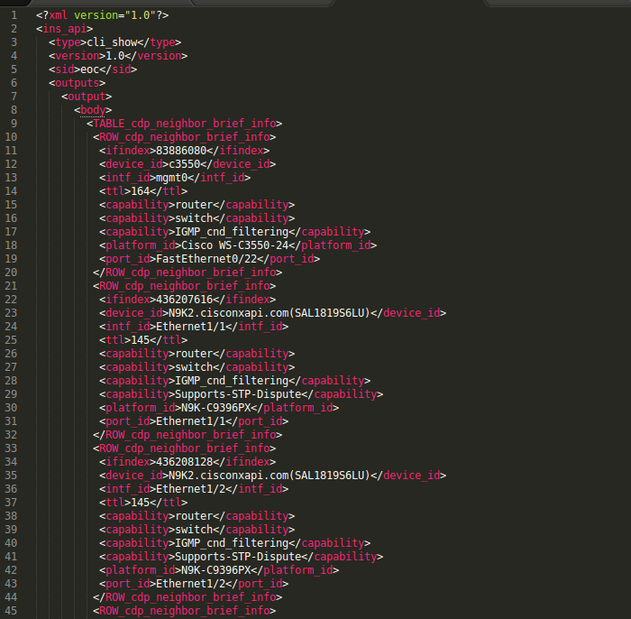
If you go back to the nexus_tables.yml file, this is exactly what item is! Now we have the command and item, but what are key and view. Since there can be any number of given neighbors, we need a way to reference each one. Here, as the user, or network automator (is that even a word?), you can pick anything unique that you want to use as the neighbor ID, or KEY. We are using the intf_id because we know that’s always unique and will be the interface name. As you’ll see from the picture above, the intf_id’s are mgmt0, Ethernet1/1, Ethernet1/2, etc.
The last part in the table definition is the view that should be used. You may already be able to decipher what the view is doing, but it is basically slicing and dicing what should be included “under the key” for each neighbor. You can see 9 things that define each neighbor that include: device_id, intf_id, ttl, capabilities, platform_id, etc. The view allows you to select exactly what data you want because you may not need everything.
The last part in the table definition is the view that should be used. You may already be able to decipher what the view is doing, but it is basically slicing and dicing what should be included “under the key” for each neighbor. You can see 9 things that define each neighbor that include: device_id, intf_id, ttl, capabilities, platform_id, etc. The view allows you to select exactly what data you want because you may not need everything.
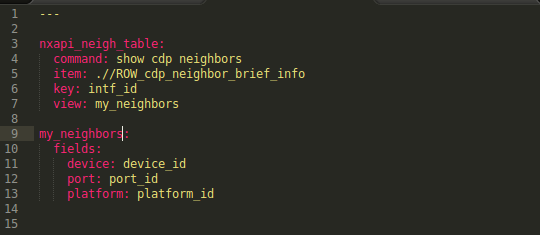
You can see that lines 9-13 are the view and line 7 calls the view. If we combine the table and view, we now can see that we’ll have collected neighbor data from the switch that stores it based on the interface name (intf_id) and within each interface name, we’ll be able to access three details about the neighbor from the view, namely, the device_id, port_id, and platform_id. And by the way, you can call these things whatever you want. If you wanted to call the port_id, “interface,” you could just by typing “interface: port_id” in line 12.
If you go back to the first picture, you will see that the second action in the workbook was to specify the exact table you want to get data from. You need to do this because you can have more than 1 table being used. We’ll see this shortly. So, you see the action called “get_tables” retrieves the data using the table/view specified, but also then calls the “opipe” action, that then just stores the data into a local file that is called neighbors.json.
Let’s get back to Schprokits and see this in action, so it makes more sense. If we execute the workbook, we see the following. Remember, I’m executing this on three (3) Nexus devices that have NX-API enabled. The cat3550 is not being access programmatically.
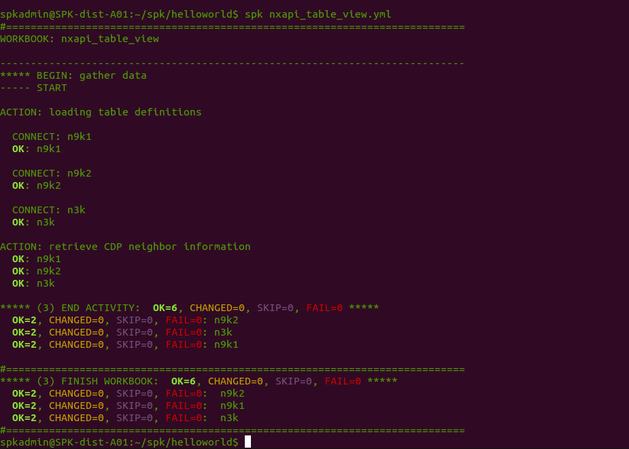
Everything looks okay. This means, we should have three new files call neighbors.json. Each device has their own directory. Let’s take a look at one of them to see what the data looks like.
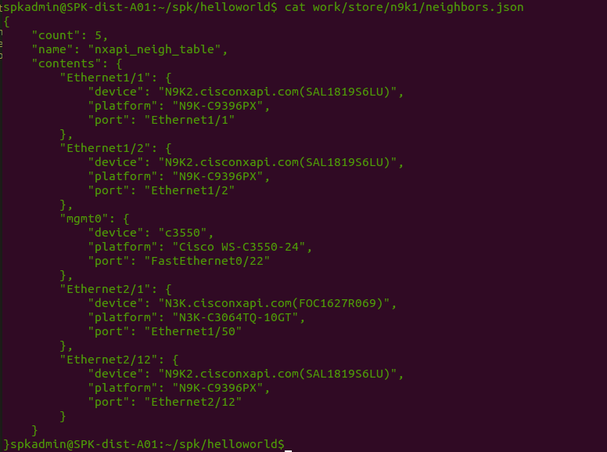
Can you see how the table/view for neighbors matches up to this?
Adding more Tables/Views
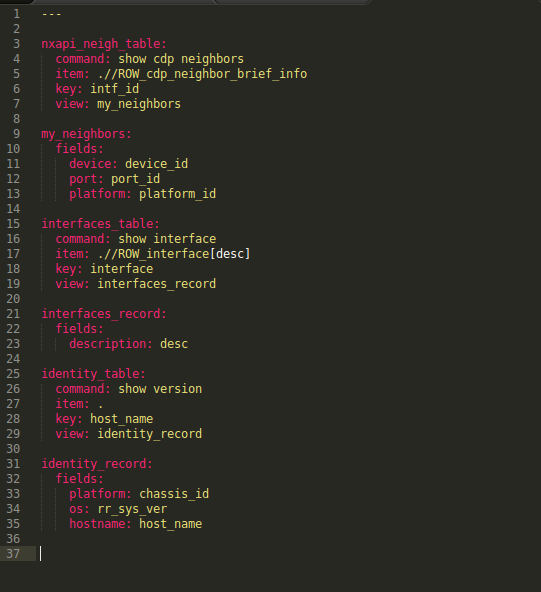
I’m going to now add two more tables that will help gather more relevant data for creating the diagram that I so desire :).
With these changes, the updated tables file looks like this:
Adding more Tables/Views
I’m going to now add two more tables that will help gather more relevant data for creating the diagram that I so desire :).
With these changes, the updated tables file looks like this:
And the workbook looks like this:
At this point, we have three (3) files per device. This is the data required to create the diagram.
Note: based on the complexity of the diagram, you can retrieve a lot more data such as IP addressing, L3 information, etc. to make different types and more detailed diagrams.
Extending Schprokits – creating an action that uses AutoNetkit
Due to the extensibility and openness of Schprokits and AutoNetkit, I was able to create a custom action in Schprokits that creates a diagram. To create a diagram, we need to send the three (3) files per device to the diagram action along with the path where to find the files. I’ve now created a second activity in the Schprokits workbook that will create the diagram. The activity is pretty straightforward and looks like this:
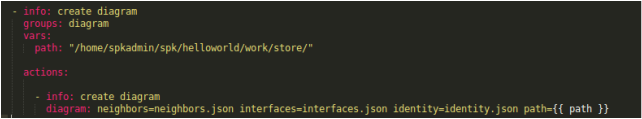
The new complete workbook is now comprised of two (2) activities. In the first activity, there are four actions, one to pull in table definitions, and then three to extract the required data from the devices. In the second activity, there is just one action, called diagram, that sends the data files that were created from the first activity, to the diagram action.
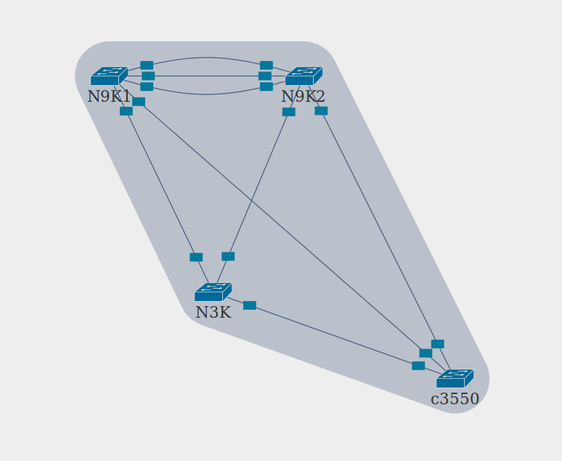
The output is a sleek looking diagram that is using AutoNetkit on the back end.
Here is the diagram that is created after running the updated workbook.
The output is a sleek looking diagram that is using AutoNetkit on the back end.
Here is the diagram that is created after running the updated workbook.
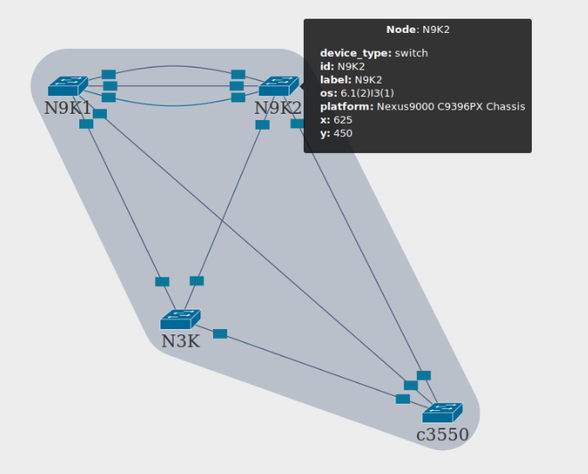
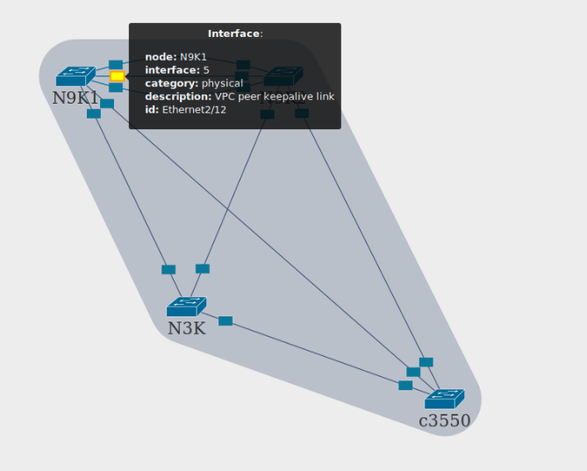
Also notice that if you hover over the interface, link, or device, you get more contextual data about each.
You may also realize that Schprokits did NOT connect to the 3550, but still displayed it on the diagram. Based on the neighbor data received from other devices, the diagram action was smart enough to realize there was another device on the network to include in the diagram. This can come in handy for phones, access points, virtual switches running CDP/LLDP, or peering points, etc.
One more thing that the diagram action can do based on this is let the user select how they want to treat “unknown” devices like the 3550. In the diagram above, it was treated as “unknown” and placed in the bottom right of the diagram.
Let’s change this to treat unknowns as leafs, just for the heck of it, to see how it works.
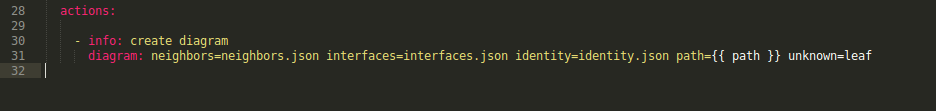
This requires a small change to workbook. Notice the last parameter in the following picture: unknown=leaf
One more thing that the diagram action can do based on this is let the user select how they want to treat “unknown” devices like the 3550. In the diagram above, it was treated as “unknown” and placed in the bottom right of the diagram.
Let’s change this to treat unknowns as leafs, just for the heck of it, to see how it works.
This requires a small change to workbook. Notice the last parameter in the following picture: unknown=leaf
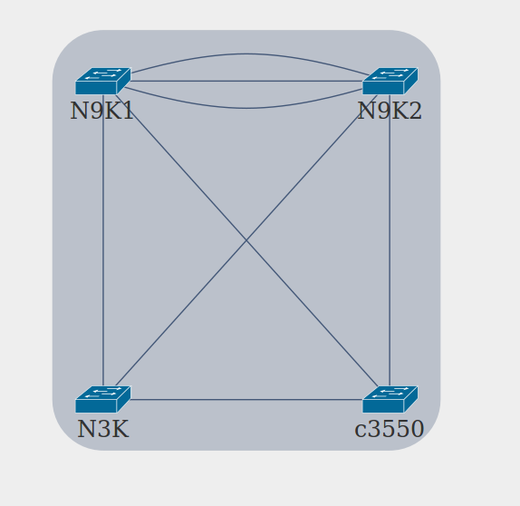
After re-running the workbook, the new diagram will treat the 3550 as a leaf in terms of placement on the diagram. The result looks like this (there is also a checkbox to remove the interface descriptions which I selected here as well):
I need to recognize Simon Knight, creator of AutoNetkit. I ran into a few snags and bugs along the way and he was gracious enough to spend some time make sure I got the diagrams working! Thanks again Simon.
This is just one small use case for network automation with Schprokits, but as an early user of the platform, it could have the potential to revolutionize the way networks are managed and operated.
Would love to hear your thoughts below. If you have any specific product questions, you should reach out to them directly, of course. Here are their contact pages: Schprokits and AutoNetkit.
Thanks,
Jason
Twitter: @jedelman8
 RSS Feed
